Home / Features
FeaturesSix capabilities that feed each other: a video analysis of the water in front of you, a daily index of the conditions around it, and a model that learns from the trips you log. The first and the last are why LureScore exists — the rest of the category covers forecasts, maps and logs, not the water itself.
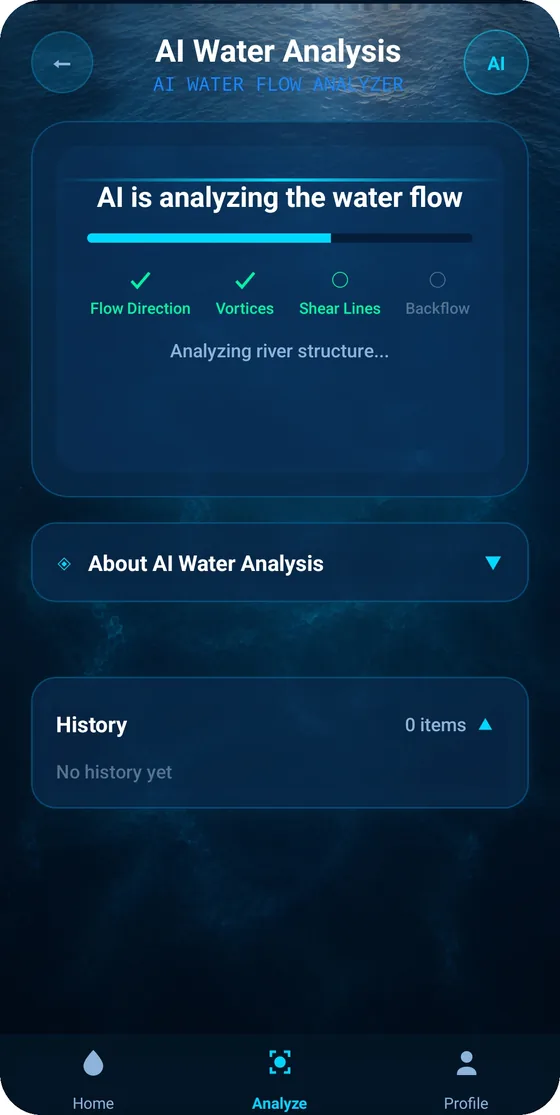
You record five to thirty seconds of the water surface. LureScore's computer-vision pipeline measures how the surface moves between consecutive frames — dense optical flow — and from that motion field it detects hydrodynamic structures rather than guessing from a single still photo.
The structures that matter to a lure angler are the ones that break the current: backflows behind rocks and points, shear lines where fast and slow water meet, vortices that spin off structure, and slow-flow pockets where a fish can hold without spending energy. Baitfish get pushed along the seams, and predatory fish sit just outside the fast water waiting for them.
LureScore draws those features back onto your own frame and ranks the spots it found, so you can work the bank in order of promise instead of covering water at random. The ranking is a starting point for your judgement — it is not a claim that a fish is sitting at a specific coordinate.
The index is a single 0 to 100 number for a given day and a given location. Air temperature, barometric pressure and the direction the pressure is moving, wind, humidity and light level are combined into one score, weighted by how much each input tends to matter on moving water.
The point is comparison. A high-pressure bluebird day and a day on a falling barometer ahead of a front score very differently, and seeing that difference before you drive to the lake is more useful than any absolute number. A 74 on your home river means more to you than a 74 somewhere you have never fished.
Alongside the system index, LureScore builds a personal index from the trips you log, so the score gradually reflects your waters and your patterns rather than a national average.
Scores are a planning signal. They tell you which window deserves more of your attention — they do not locate fish and they do not promise a catch.
A barometer reading on its own says very little. What matters is where it came from and where it is going: a slow, steady fall over a day and a half is a different session from a sharp drop overnight or a fast rebound in the hours after a front passes.
LureScore shows live conditions next to a multi-day trend line, so you can watch a pattern build through the week and pick the window that matches how fish behave on your home water. Wind is shown as sustained speed and direction, not just a gust figure, because direction decides which bank is fishable at all.
Weather data is fetched for the location you select, refreshed through the day, and used both for the displayed forecast and as an input to the fishing index.
Generic advice is easy to write and hard to trust. LureScore takes the other route: it learns from what you actually did.
Every logged trip records the date, the water, the conditions you fished in, the baits you used, what you caught and what you did not. Over a season that becomes a personal dataset, and LureScore builds a per-species growth model from it — which patterns produce on your waters, at what time of year, under which pressure trend.
The more you log, the more the recommendations shift from regional averages toward your own record. Nothing is shared publicly, and the model is tied to your account.
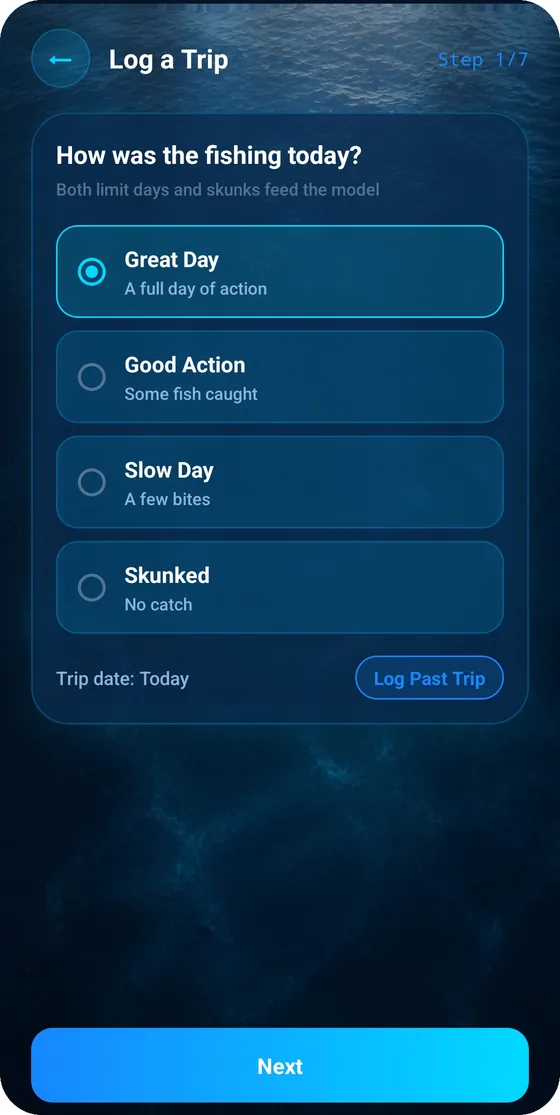
A fishing log only works if keeping it is effortless. Logging a trip in LureScore takes under a minute: date, water, conditions, bait, result. Conditions can be pulled from the day's data rather than typed in by hand.
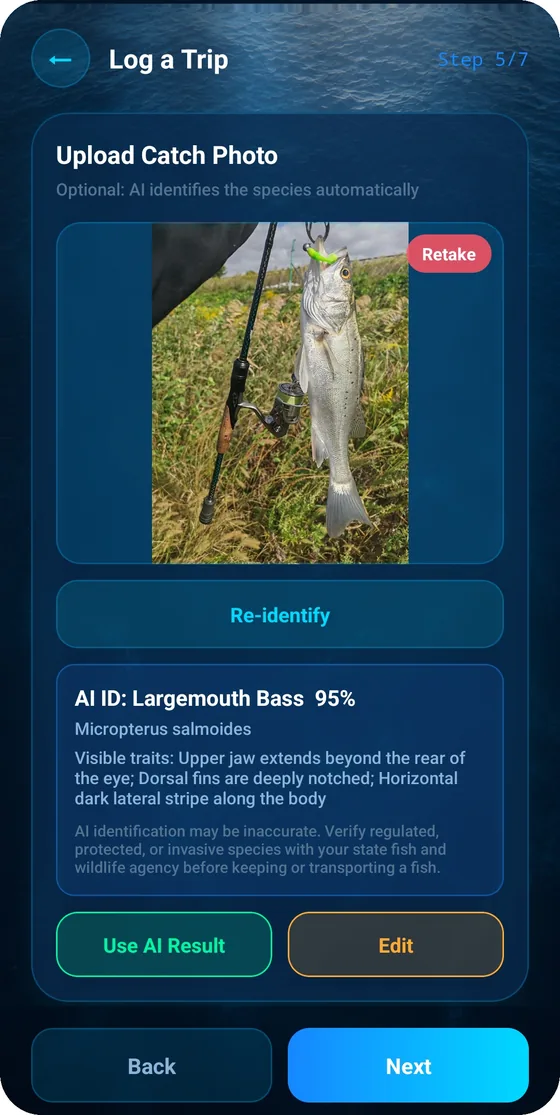
Attach a photo and the app identifies the species for you, which keeps your record consistent across a season instead of drifting between names. Over time the log answers questions you could not answer from memory: which bait kept working in stained water, which month your best fish came from, whether the pressure trend you believe in is real in your own data.
Records and photos are private to your account.
LureScore is built around the fish lure anglers actually chase: largemouth and smallmouth bass, northern pike, muskie, walleye, rainbow and brown trout, salmon, striped bass and bluefish, among others.
The species list is not decoration. It is the key the rest of the app is organised around — analysis results, index weighting, your personal model and your catch log are all tied to a species, so comparisons stay meaningful instead of mixing a trout drift with a bass flat.
 LureScore